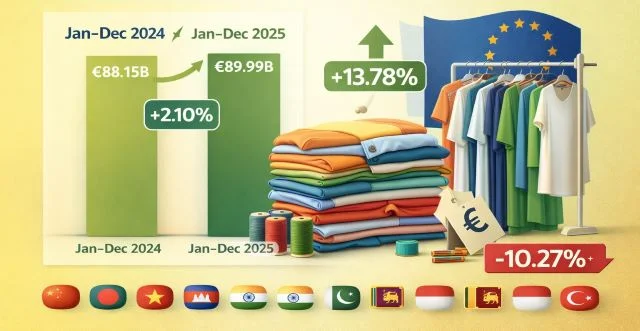
The European Union’s apparel imports recorded steady but moderate growth in 2025, as higher shipment volumes compensated for continued price pressure in the global clothing market. According to Eurostat, total EU apparel imports reached €89.996 billion in January–December 2025, compared with €88.15 billion in 2024, marking a 2.10% year-on-year increase.
Although the value growth appears limited, the underlying market trend is more significant. Import volumes surged by 13.78% during the year, indicating the EU purchased substantially more garments. However, this expansion came alongside a 10.27% decline in average unit prices. In simple terms, Europe bought more clothing in 2025, but at lower prices. This reflects intense price competition among global suppliers and cautious consumer spending across European markets.

Bangladesh continued to strengthen its position as the EU’s second-largest apparel supplier. Exports to the bloc rose from €18.32 billion in 2024 to €19.41 billion in 2025, representing 5.97% growth. The improvement was mainly driven by a 10.20% increase in export volume, while the average unit price declined by 3.84%. This indicates that Bangladesh remained competitive by supplying larger quantities despite downward price pressure.
At the same time, monthly data shows that the year ended on a weak note across major suppliers.
EU Apparel Import Data (Value in Million Euros)
Source: Eurostat
| Country | Dec-24 | Dec-25 | Growth | Jan–Dec 2024 | Jan–Dec 2025 | Growth |
| World | 7,110.99 | 6,949.33 | -2.27% | 88,145.26 | 89,996.00 | 2.10% |
| China | 2,153.69 | 2,111.02 | -1.98% | 26,274.50 | 26,581.71 | 1.17% |
| Bangladesh | 1,541.69 | 1,355.99 | -12.05% | 18,319.97 | 19,414.55 | 5.97% |
| Turkey | 707.62 | 653.96 | -7.58% | 9,345.94 | 8,343.59 | -10.73% |
| India | 270.21 | 280.91 | 3.96% | 4,189.11 | 4,524.02 | 7.99% |
| Cambodia | 319.12 | 349.78 | 9.61% | 3,918.83 | 4,493.39 | 14.66% |
| Vietnam | 344.66 | 367.63 | 6.66% | 3,992.34 | 4,378.10 | 9.66% |
| Pakistan | 307.54 | 312.02 | 1.46% | 3,519.23 | 3,858.51 | 9.64% |
| Morocco | 208.85 | 204.02 | -2.31% | 2,736.68 | 2,727.67 | -0.33% |
| Sri Lanka | 95.03 | 101.42 | 6.73% | 1,278.73 | 1,361.18 | 6.45% |
| Indonesia | 69.53 | 68.15 | -1.98% | 942.63 | 970.20 | 2.92% |
Also read: EU Targets Textile Waste with New Ban
The table shows that in December 2025, overall EU apparel imports declined by 2.27% compared to December 2024. Bangladesh experienced a sharper monthly fall of 12.05%, mainly due to a significant drop in unit prices. Turkey also saw a notable monthly decline, while countries such as India, Cambodia, Vietnam, and Sri Lanka recorded positive December growth.
For the full year, China remained the EU’s largest supplier with €26.58 billion in exports, followed by Bangladesh at €19.41 billion. Cambodia posted the highest annual growth rate at 14.66%, while Vietnam, Pakistan, and India also delivered strong performances. In contrast, Turkey registered a significant annual contraction of 10.73%, highlighting competitive challenges.
Overall, the 2025 data clearly indicate that EU apparel import growth was driven primarily by volume expansion rather than pricing power. The combination of rising quantities and falling unit prices reflects intense competition among suppliers and continued cost-conscious sourcing by European buyers.
It is important to note that differences in data collection, timing, and methodology may result in slight variations between Eurostat figures and national export statistics.


